Hunting a connection leak: from an OOM to a one-line fix in a third-party library
We have a GraphQL gateway sitting between the web app and a handful of backend services. The browser
opens one sync subscription over Server-Sent Events; the gateway fans that out to a per-service SSE
subscription each and merges them back into one stream. Nothing exotic:
browser ──SSE──▶ gateway ──SSE──▶ service A
                        ├──SSE──▶ service B
                        └──SSE──▶ service C
One of the backend services kept running out of memory in production and dying. It took me way longer than I’d like to admit to find out why, and I made a lot of confident wrong calls on the way. This is the whole thing, wrong turns included.
1. Symptoms
The first signal was blunt: a service OOM’d in prod about four days after we shipped an unrelated reconnect fix. Heap limit hit, process killed, restarted on its own.
The ALB metrics in CloudWatch were clearer once I looked at the right one:
- The active-connection count climbed steadily all day - a few hundred an hour - and only dropped back to near-zero when the process restarted.
- Request volume was basically flat and basically zero. The service was doing almost nothing.
- Right before a crash it’d be at roughly 10,000 concurrent connections against fewer than 200 requests an hour.
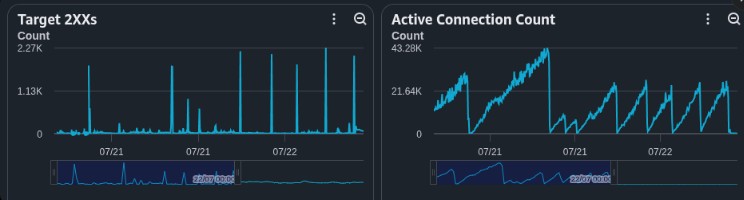
Before the fix. Active connections (right) climb and climb, only sawtoothing back to zero on a restart, while request volume (left) stays low. Note the right-hand axis is a per-period sum, so it tops out around 43K - actual concurrency peaked closer to 10,000. Either way the shape is the tell: connections rising while the service does no work is a leak, not load.
Two things I got wrong early and nearly went the wrong way over:
- I read the connection metric with the wrong aggregation and got
0. It’s only meaningful summed, not maxed, and reading it wrong hid a ~10,000-connection leak for a while. If a dashboard says zero for something you can watch happening, doubt the query first. - I then took an hourly sum, divided by 60, and quoted that as a “concurrent” number. It’s fuzzier than that - the metric samples several times a minute. The exact number didn’t matter anyway; the ratio and the fact that it only ever went up did.
The thing that actually cracked it came later: a second service, near-idle with no big payloads and
no real workload, showed the exact same sawtooth. That told me this wasn’t about one service’s
workload - the leak was in code all the services shared, the gateway’s sync subscription. (The
payload angle wasn’t wrong, it turned out - it was the trigger, not the cause. More on that below.)
That near-idle service ended up being the most useful data point in the whole investigation, and I
didn’t set it up on purpose.
2. First guesses
My starting theory, which was half right:
A heavy request burns CPU → sync falls behind → the gateway hammers the service trying to reconnect → it falls over.
So my first guesses were all about load and payload:
- Some pathological request with a ton of work behind it.
- The gateway broadcasting a big object to lots of subscribers (“fan-out amplification”).
- The browser reconnecting too aggressively and creating a connection storm.
The reconnect angle had history - we’d actually had reconnect storms before - so it felt credible. That’s probably why it was so hard to drop.
3. Wrong theories
Roughly in the order I chased them:
- “Send a smaller payload on the once-a-day broadcast path.” There’s a path that periodically broadcasts a full object, and I was sure it was the amplifier. Turns out that payload is load-bearing - the client uses it to reconcile its local state - so “just send less” would have been a silent data-corruption bug. I only caught that by reading the consumer instead of the producer.
- Blaming observability overhead. When I tried to reproduce the OOM locally, memory usage didn’t match prod, and for a while I convinced myself the difference was just tracing and logging eating memory. It wasn’t - that was a cop-out for not knowing yet, and it led nowhere.
- “The stream-merging helper leaks its children.” The gateway merges the per-service streams with
a small combinator, and I figured it wasn’t cleaning up on teardown. So I read the installed source.
It calls
return()on every child in afinally. It was fine. - “There’s a race in the subscribe path.” My first real code change. There’s a window where the client can disconnect while the resolver is still opening the upstreams. I fixed it, shipped it, and the prod curve didn’t budge. It was a genuine bug, just a tiny slice of the leak. I’d found a bug and talked myself into it being the bug.
The pattern here is the annoying one: a plausible fix you’re confident about isn’t the same as the fix. The only thing that settled any of it was watching a number move.
4. Buying some breathing room
Two things about how I sequenced this, because it’s the part I’d repeat.
First, we took the pressure off. Instead of debugging a service that was actively falling over, we put in a dumb guard: restart the component when connections crossed a threshold well under the danger zone. Ugly, but it turned “prod is crashing” into “prod restarts itself before anyone notices,” and that bought me time to actually think.
Second, since I knew the real fix would take a while, I built a deliberate workaround as a bridge. By now I understood the leak as abandoned upstream subscriptions never getting torn down, and I knew one useful property of the system:
The gateway’s SSE consumer parks on
await, waiting for the next event from upstream. On a quiet stream nothing arrives, so it parks forever and its teardown never runs. But any event at all wakes it up and lets teardown finish.
So the workaround was to nudge each upstream with a tiny no-op event, which wakes every parked consumer for that scope and lets it clean up. Reversible, targeted, never meant to be permanent.
Then I had it torn apart in review before it went anywhere, which was the right call - it caught stuff I’d have shipped:
- Every one of my new tests couldn’t actually fail. I’d asserted against a field that doesn’t exist in that context, and copy-pasted the mistake around.
- The nudge fanned out with the wrong cost profile on the reconnect path - the same amplification shape as the incident itself.
- It only cleaned up scopes that saw new activity, so genuinely idle ones would still leak.
- A
try/catcharound a fire-and-forget promise can’t catch the rejection - on the runtime’s defaults that’s a process crash waiting to happen.
None of that made the workaround wrong; a bridge is allowed to be rough. But prod was already stable, so there was no reason to rush an imperfect bridge out the door. Better to spend the time on the actual cause, so that’s what I did.
5. Finding it
Two tools made the difference, and I should have reached for both way earlier.
A repro harness
I stopped guessing against prod and built a local one:
- A small script that opens N real SSE subscriptions through the local gateway and holds them.
- A counter that reads the kernel’s TCP table (
/proc/net/tcp) inside the gateway container and reports established connections per upstream, keyed to the exact local ports my script opened, so background traffic couldn’t pollute the count.
Now the experiment was: open N, kill -9 the client, watch those specific sockets. Sixty seconds,
repeatable. Every candidate fix went from a multi-day prod wait to a one-minute test. I built this
embarrassingly late.
Making sure I was measuring the right file
When you patch a dependency in place to test a theory, it’s easy to edit a build the runtime never loads. A package can ship both an ESM and a CommonJS build, and more than one version can resolve in the tree, so the file you opened and the file actually running aren’t necessarily the same. A negative result from the wrong file looks identical to a negative result from a bad fix.
So when I patch a dependency in place, I stamp the code I think is running with a version string and a fresh random nonce per run, and I don’t trust any result until I see the stamp in the logs:
PATCHMARK v3.3.0 nonce=9C8F -> reader.cancel()   × 12
my sockets: 12  →  0 of 12 ESTABLISHED at t+5s, t+20s, t+45s
Twelve sockets, twelve stamps, matching nonce. Good enough to trust.
The actual bug
With that in place the trace was obvious. In the version we ran, the SSE consumer was a bare async
generator with no cleanup at all - parked on await, and since a suspended generator can’t process a
queued return(), teardown was unreachable while it waited for a chunk that (on a quiet stream) never
came. A newer version had rewritten that with a proper teardown path.
But the newer version still leaked. Here’s its teardown:
stop.then(() => {
  subscriptionCtrl?.abort();
  if (body.locked) {
    reader.releaseLock();   // ← detaches the reader; the body is never cancelled
  }
});
ReadableStreamDefaultReader.releaseLock() releases the reader’s lock on the stream. It does not
cancel the stream. The response body stays alive, the underlying HTTP connection is never released,
and the socket stays ESTABLISHED. The call that actually tears the connection down, reader.cancel(),
was only on the error path, never the normal one.
So there were two different bugs stacked on top of each other: the old version made teardown unreachable, the new one made it reachable but useless. Treating them as one bug is what kept “just upgrade the dependency” looking like it might work when it couldn’t.
Same harness, same file, back to back:
| Build | Sockets still open after client death |
|---|---|
| version we ran | 0 of 11 closed |
| latest, stock | 0 of 12 closed |
latest + releaseLock() → cancel() | 12 of 12 closed within 5s |
That explains the leak, but not the crash - a high connection count isn’t automatically an OOM. The trigger was the payload angle I’d written off early. The leak left hundreds of stale connections per user that the service still thought were live. When one user saved a calculation with a big payload, the gateway fanned that payload out to every one of their connections at once: the single live subscription plus a few hundred dead ones. A normal broadcast, multiplied across a few hundred phantom subscribers, is what spiked memory and tipped it over. So “fan-out amplification” wasn’t wrong, just backwards - the fan-out was the trigger, the leak was what made it lethal.
6. The fix
One line:
-      reader.releaseLock();
+      reader.cancel().catch(() => {});
(The .catch(() => {}) is there because cancelling an already-errored stream can reject, and teardown
shouldn’t blow up over that.)
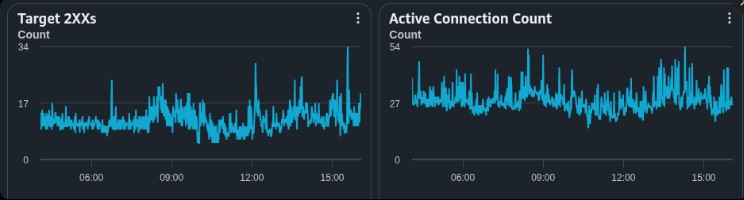
After the one-line fix, same metrics over a similar window. Connection count (right) sits in the tens now and follows actual request volume instead of climbing forever. No sawtooth, no restarts.
Rollout was two parts:
- In our own repo, right away: pinned the dependency version and applied the one-line change as a
package-manager patch, so we could drop the restart guard and run a real fix without waiting on
anyone. Verified through the actual install path, not a hand-edited
node_modules, again with the version+nonce stamp. - Upstream: the real fix belongs in the library. One wrinkle - the package had moved repositories between the version we ran and the current one, so the obvious repo was the wrong one. Worth checking the package metadata instead of assuming. I fixed it at the source, added the changeset the project wants, and ran their full CI locally (format, lint, types, peer-deps, build, bundle, unit tests). All green, after I checked that two already-failing test files fail the same way on a clean checkout so I wouldn’t get blamed for them. Then a fork, a PR, and an issue with the evidence table.
One last annoyance: while cleaning up, a service wouldn’t start. A generated artifact was stale, so the schema and the code disagreed. Typecheck, lint, and unit tests were all green. It just didn’t boot. I’d have caught it by starting the thing once.
7. What I’d take away
A few things stuck with me. Stabilising first - even with a dumb auto-restart - was what let me slow down and get it right instead of shipping something clever under pressure. The repro harness was the single highest-leverage thing I did and I built it far too late; days of prod inference collapsed into 60-second tests once it existed. And when you’re patching a dependency in place, prove your instrumentation is actually running before you believe a negative result, because measuring the wrong file wastes days.
The bug itself is a small API distinction with a big blast radius: releaseLock() detaches a stream
reader, it doesn’t close the stream or the connection. If you want the resource freed you have to
cancel it. That one confusion was worth ~10,000 leaked sockets and an OOM.
For what it’s worth, the fix upstream is still one line - releaseLock() → cancel() in the SSE
teardown of a fairly widely-used GraphQL-over-HTTP executor, and it was still there in the latest
published version when I wrote this. If you run a gateway that proxies SSE subscriptions, it’s worth a
look.